Practice Exercises - Statistics in AP Biology - AP Biology Premium 2024
Practice Questions
Multiple-Choice
1. Which of the following can be used to describe the center of a data set and is NOT affected by extreme values in the data set?
(A) mean
(B) median
(C) standard deviation
(D) standard error of the mean
2. Data Set A consists of {10, 15, 15, 20, 25}. Data Set B consists of {15, 15, 17, 19, 19}. Which of the following descriptive statistics is the same for both data set A and data set B?
(A) mean
(B) median
(C) standard deviation
(D) standard error of the mean
3. The chi-square test is appropriate to compare which of the following types of data?
(A) means
(B) percentages
(C) processed data
(D) raw data
4. In a dihybrid cross of two organisms (AaBb × AaBb), four different phenotypes of offspring can be produced. How many degrees of freedom would there be?
(A) 1
(B) 2
(C) 3
(D) 4
5.In pea plants, the tall (T) allele is dominant to the dwarf (t) allele. Two heterozygous (Tt) pea plants are crossed and produce 400 offspring. Three hundred offspring are expected to be tall, and 100 are expected to be short. There are 290 tall offspring observed and 110 dwarf offspring observed. Calculate the chi-square value from this data (using a p-value of 0.05), and state whether there is likely a statistically significant difference between the observed and expected data.
(A) The chi-square value is 0.67. There is a statistically significant difference between the observed and expected data.
(B) The chi-square value is 0.67. There is NOT a statistically significant difference between the observed and expected data.
(C) The chi-square value is 1.33. There is a statistically significant difference between the observed and expected data.
(D) The chi-square value is 1.33. There is NOT a statistically significant difference between the observed and expected data.
6. A student wanted to see if isopods preferred banana or watermelon as a food source. Twenty isopods were placed in the center of a choice chamber with two compartments. Banana was placed in one compartment, and watermelon was placed in the second compartment. After 15 minutes, the number of isopods in each compartment was counted. Data are shown in the table.
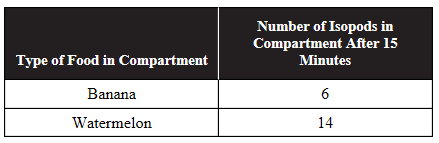
The null hypothesis was that the isopods would have no food preference and would be found in equal numbers in both compartments. Calculate the chi-square value (using a p-value of 0.05), and determine if there was a statistically significant difference between the observed and expected data in this experiment.
(A) The chi-square value is 0.80. There is a statistically significant difference between the observed and expected data.
(B) The chi-square value is 0.80. There is NOT a statistically significant difference between the observed and expected data.
(C) The chi-square value is 3.20. There is a statistically significant difference between the observed and expected data.
(D) The chi-square value is 3.20. There is NOT a statistically significant difference between the observed and expected data.
7. Data Set X and Data Set Y have the same standard deviations. Data Set X has a sample size of 10, while Data Set Y has a sample size of 50. How will their standard errors of the mean compare?
(A) Data Set X will have a larger standard error of the mean than Data Set Y.
(B) Data Set Y will have a larger standard error of the mean than Data Set X.
(C) Both data sets will have the same standard error of the mean.
(D) The difference in the standard errors of the mean cannot be determined from the information given.
Questions 8 and 9
The heights of oak trees in four different locations were measured. The mean height and the standard error of the means were calculated for each location and are shown in the table.
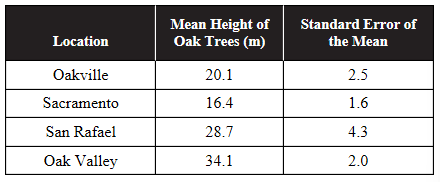
8. Which location showed the greatest variability in the heights of the oak trees?
(A) Oakville
(B) Sacramento
(C) San Rafael
(D) Oak Valley
9. Which of the following two locations are likely to have a statistically significant difference between the heights of their oak trees?
(A) Oakville and Sacramento
(B) Oakville and Oak Valley
(C) San Rafael and Oak Valley
(D) San Rafael and Oakville
_____________________________________________________________________
(A) Mean ± 1(Standard Deviation)
(B) Mean ± 1(Standard Error of the Mean)
(C) Mean ± 2(Standard Deviation)
(D) Mean ± 2(Standard Error of the Mean)
Short Free-Response
11. Some chemicals are known to increase the frequency of chromosome breakage in dividing cells. Thirty Petri dishes with dividing cells were treated with either lead (10 Petri dishes), cadmium (10 Petri dishes), or control solutions (10 Petri dishes). Forty-eight hours after treatment, each Petri dish was examined, and the percentage of cells that showed chromosome breakage in each Petri dish was calculated. The mean percentage of cells that showed chromosome breakage and the standard error of the mean for each treatment were calculated and are shown in the table.
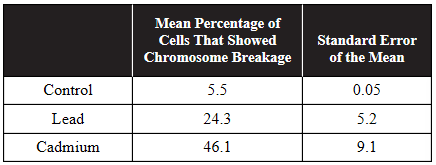
(a) Describe which treatment produced the greatest variability in the data.
(b) Describe which treatment was least likely to result in chromosome breakage.
(c) A student claims that exposure to cadmium is more likely to result in chromosome breakage than exposure to lead. Evaluate this claim using the data provided.
(d) Identify the independent variable and the dependent variable in this experiment.
12. In tobacco plants, green (G) is dominant to albino (g). A heterozygous green (Gg) tobacco plant is crossed with an albino (gg) tobacco plant, and 100 offspring are produced. Fifty offspring are expected to be green (Gg), and 50 offspring are expected to be albino (gg). However, when the offspring are counted, 60 green plants and 40 albino plants are observed.
(a) Identify the degrees of freedom in this experiment.
(b) Calculate the chi-square value for this data.
(c) Make a claim about whether or not the observed data are likely significantly different statistically from the expected data. Use a p-value of 0.05.
(d) Justify your claim from part (c) with your knowledge of the chi-square test.
Long Free-Response
13. Organic gardeners will sometimes use ladybugs as a method of reducing aphid populations in their gardens. A garden infested with aphids is divided into three sections. In the first section, no treatment (to reduce the aphid populations) is applied. In the second section, ladybugs are introduced to reduce the aphid populations. In the third section, a chemical pesticide is used to reduce the aphid populations. One week after the treatments are applied, 10 measurements of the density of the aphid populations (in aphids per square decimeter) are taken in each section of the garden. The means and the 95% confidence intervals for each section of the garden are shown in the graph.
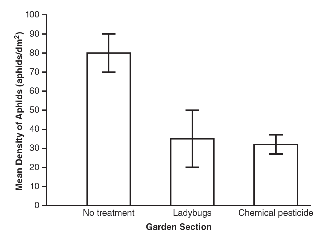
(a) Based on the graph, identify the section of the garden with the least variability in aphid density and the section of the garden with the most variability in aphid density one week after treatment.
(b) Analyze the data shown in the graph to determine which sections of the garden are most likely to have a statistically significant difference in aphid density.
(c) In this experiment, 10 measurements (n = 10) of the aphid density were taken in each section of the garden. If 50 measurements (n = 50) were taken, make a prediction about the effect, if any, this would have on the 95% confidence intervals.
(d) Justify your prediction from part (c) using your knowledge of how 95% confidence intervals are calculated.